

Introduction
A TCO calculator for remote hiring platforms is a spreadsheet that adds up everything a vendor will really cost you over three years, then forces every vendor to be measured on the same basis. For regulated industries, that means pricing in country-level employer costs, deposits, FX margins, admin time and compliance exposure, not just the monthly fee on the quote.
Most buyers start with the quote. That’s the mistake.
A headline fee is a sales device. It tells you what the vendor wants to be compared on, and in healthcare, fintech or defence that comparison can flatter the wrong supplier. Standard SaaS comparison models fall short here, because the expensive parts of a remote hiring platform sit outside the licence line: the money parked in deposits, the markup buried in currency conversion, the hours your own people spend chasing a partner entity in another time zone.
So build the calculator first, and ask for quotes second. Here is how I’d do it.
What Does a TCO Calculator Measure?
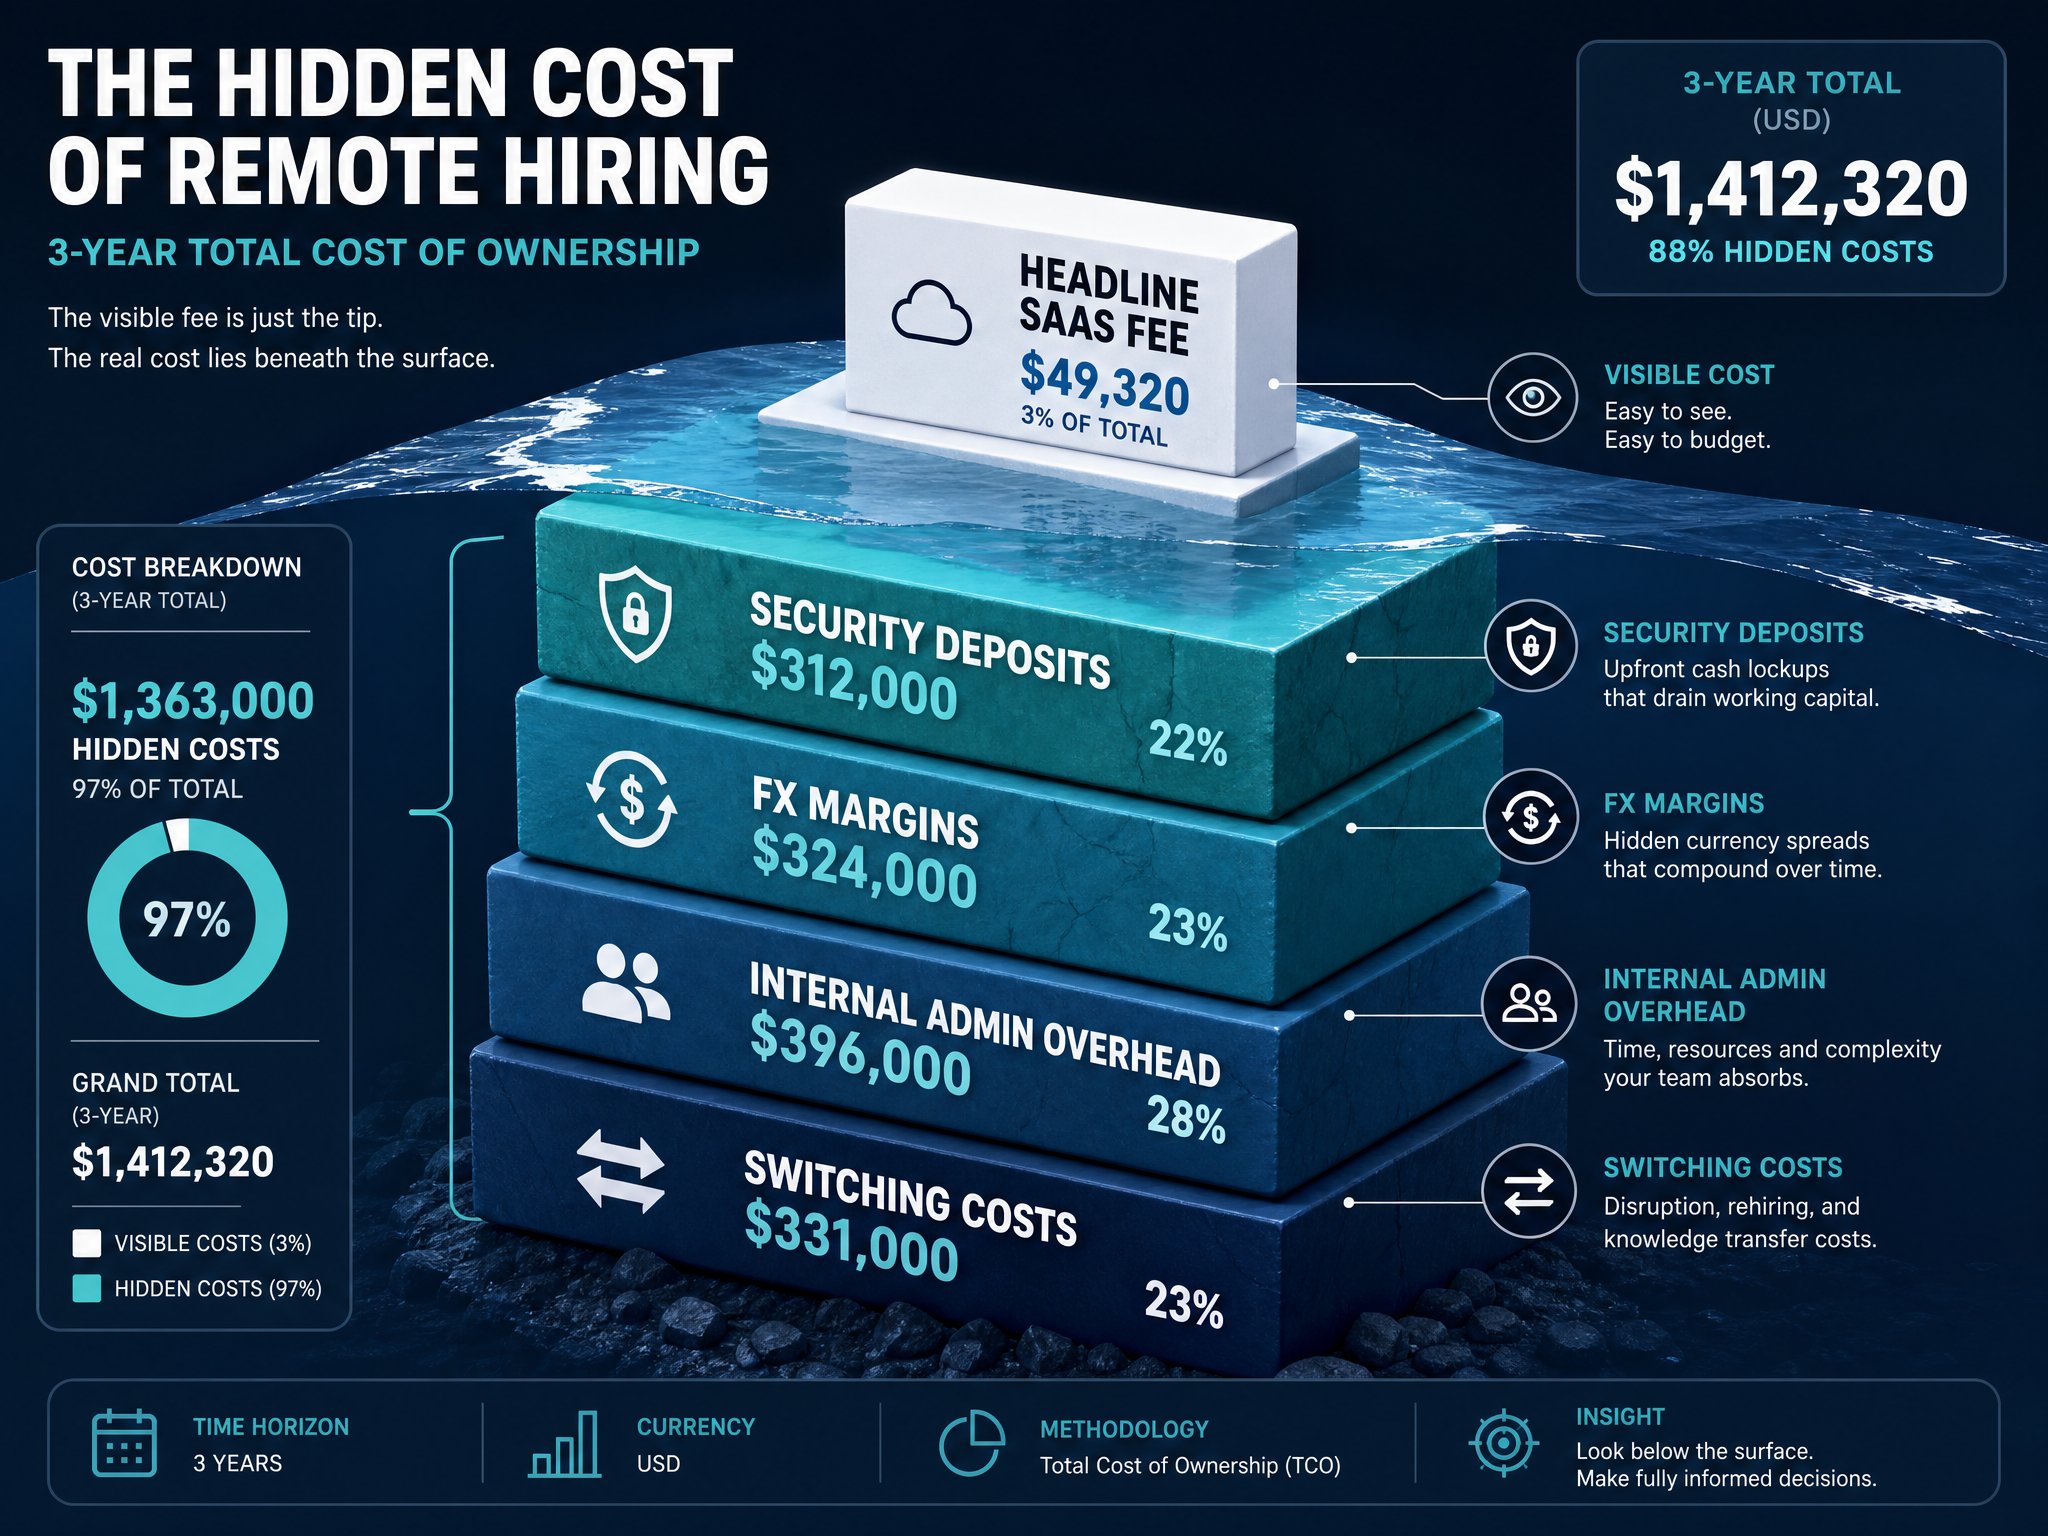
Everything you’ll pay, whether or not it appears on an invoice. That’s the short answer. The longer one has three parts.
Cost beyond headline fees
IBM’s overview of total cost of ownership frames TCO as the full lifecycle cost of an asset, from purchase price through running costs and eventually disposal. For a remote hiring platform, “disposal” is switching costs, and we’ll get to those.
Gartner’s TCO template makes the same point from another direction: hidden, unbudgeted lifecycle expenses such as support, training and downtime tend to outweigh the acquisition price. I’ve seen it play out in spreadsheets. The licence line shrinks to a minority share of what a buyer ends up paying, and the argument over which vendor is “cheaper” quietly flips.
Three-year horizon
Use three years. One year rewards vendors with cheap onboarding and punishing renewals; five years drowns you in assumptions about tax law nobody can predict. Three is the standard for enterprise software and service modelling, and it’s long enough for implementation to amortise and for a deposit to look like the drag it is.
Fixed versus variable costs
Split every line into fixed (implementation, integration work, annual platform fees) and variable (per-employee fees, employer contributions that scale with salary, FX on each payroll run). Fixed costs reward volume. Variable costs punish it. A vendor that looks wonderful at five hires can look dreadful at fifty, and your calculator needs to show both.
Which Inputs Should the Calculator Include?

Before any formula, get the inputs right. Garbage in, confident-looking garbage out.
Headcount and countries
Start with how many remote employees you’ll onboard, by country, by quarter. Not “about thirty”. Twelve in Poland, eight in Kenya, ten in Portugal, phased across the three years. Employer costs differ wildly by location because payroll taxes, social security, pensions and mandatory healthcare change per jurisdiction, so a single blended rate is a lie you tell yourself.
Add average gross salary per role and country. This is the base that deposits, FX and employer contributions all multiply against.
Regulatory frameworks
List the frameworks that bind you: GDPR, UK GDPR, HIPAA, SOC 2, ISO 27001, sector rules from the FCA or similar. These aren’t decoration. They decide which vendors are even eligible, and they set the size of your risk lines later.
Scale matters here. CCIA research puts UK data regulation costs for tech businesses at roughly £5.3 billion a year, and TheCityUK reports financial services compliance burdens above £33.9 billion annually, over 13% of operating expenses. Compliance is a real line in your budget, so your calculator should treat it like one.
Vendor quote fields
Hand every vendor the same template. No freeform PDFs. Require these fields:
Platform or EOR fee per employee per month, and any minimum commitment
Implementation and integration fees, including API or HRIS connector work
Security deposit terms, as months of gross salary
FX method: interbank rate plus margin, or flat fee
Who employs the worker in each country: owned entity or third-party partner
Offboarding, termination and data-export charges
Contract term, renewal uplift and discounts
If a vendor won’t fill in a field, that’s data. Note it.
How Do You Build the TCO Formula?
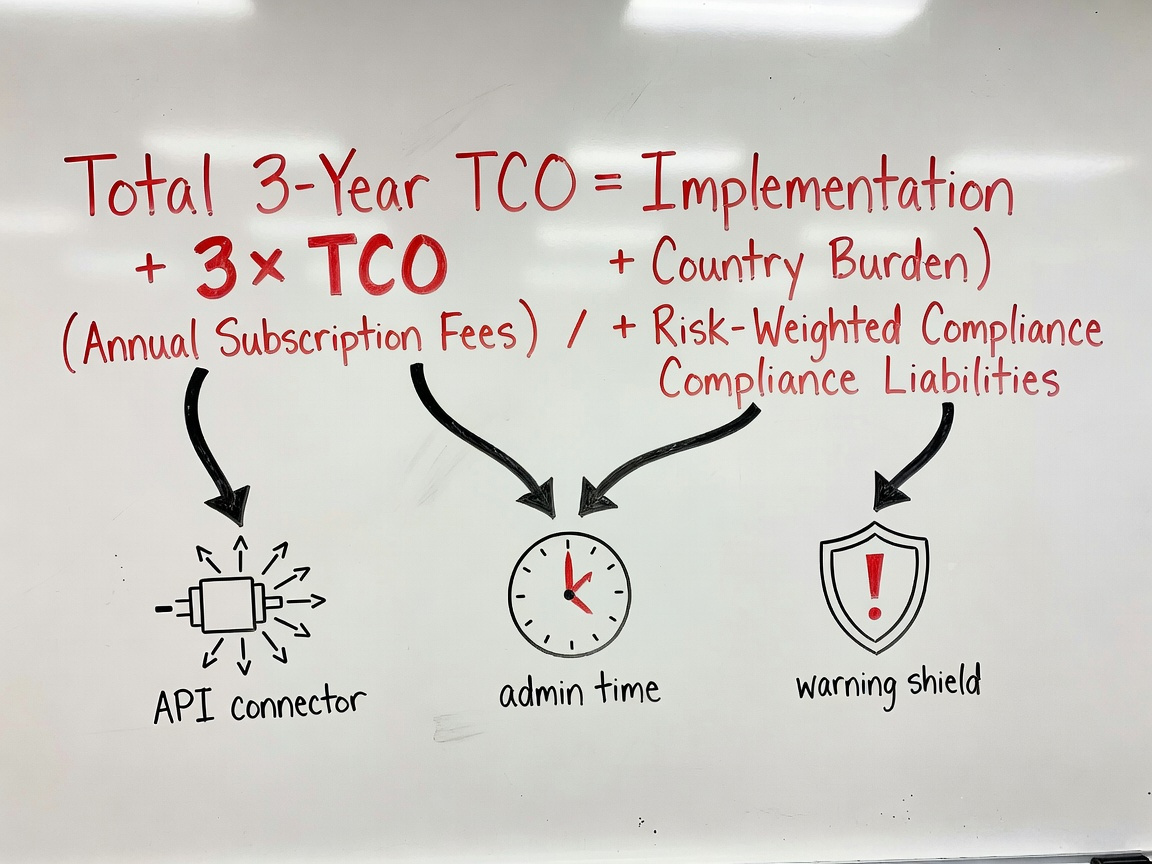
Keep it boring. A formula nobody on the finance team can audit is useless in procurement.
Total 3-Year TCO = Implementation + 3 × (Annual Subscription Fees + Country Burden + Operational Overhead) + Risk-Weighted Compliance Liabilities
Now the pieces.
Implementation and deposits
Implementation covers setup, customisation and integration with your HRIS, ATS or ERP. Engineering time counts even when it’s your own engineers; price it at a loaded hourly rate, not zero.
Deposits deserve their own row. Many EOR providers ask for one to two months of gross salary per employee as security. Ten hires on £5,000 monthly salaries with a two-month deposit is £100,000 of cash sitting idle. Model it as an upfront outlay, and if you want to be rigorous, charge it a cost of capital for the period it’s held.
Employer burden and FX markup
Employer burden is the statutory layer: payroll taxes, pensions, social contributions, benefits. It’s largely the same across vendors in the same country, so differences usually come from how each one reports it. Compare it line by line.
FX is where margins hide. Platforms often convert at a rate that isn’t interbank, and the gap vanishes into the billing statement. Apply a baseline assumption of 3% on gross payroll across all vendors, then replace it with the real number once a vendor discloses their method. Remofirst’s pricing guide and eorHQ’s comparison tool both flag hidden fees in this area. On a £600,000 annual payroll, 3% is £18,000. Every year.
Admin overhead and risk lines
Admin overhead is the “admin tax”: internal staff time spent on data entry, document chasing, manual offboarding and arbitrating between a platform and its local partners. Estimate hours per hire per month, multiply by loaded rate, and stay honest. Use the same hours assumptions as a baseline, then adjust upward for vendors with fragmented interfaces.
Risk lines come last, and they stay separate. More on that shortly.
How Do Pricing Models Compare Across Vendors?

Pricing models decide where the cost lands, not just how much of it there is. For a wider primer, this explainer on remote hiring platform pricing models covers the mechanics, and a comparison against recruiting agencies helps if agencies are still on your shortlist.
Cost category | Aggregator EOR | Owned-entity EOR |
|---|---|---|
Headline fee | Low, roughly £160 to £320 per employee monthly | Higher, roughly £480 to £800 per employee monthly |
FX margin | Variable, often uncapped | Interbank rate or flat fee |
Deposits | Often 1 to 2 months’ salary | Frequently waived or reduced |
Internal admin | High, multiple hand-offs | Lower, one interface |
Audit risk | Depends on sub-contracted partners | Direct control through owned entities |
Figures converted from US dollar ranges of $199 to $399 and $599 to $1,000; treat as indicative.
Aggregator EOR structures
Aggregators route your hire through local partner networks. The UI fee is tiny, which is the bait. Each partner adds a hand-off, a management fee and a service-level agreement you can’t directly enforce. Your team becomes the glue. I’d argue that cheap UI fees aren’t a bargain if you’re babysitting a chain of local providers.
Owned-entity EOR structures
Owned-entity vendors employ through their own legal entities in each country. Higher sticker price, fewer seams. Compliance sits under one roof, data handling is consistent, and an auditor has one party to talk to. For regulated work, that single point of accountability is worth real money.
Switching costs
Nobody models switching costs, and everybody regrets it. Include data migration, re-papering contracts with local employers, re-onboarding staff, a parallel-run period of double payroll, and the training cost of a new system. If moving a worker between EOR entities triggers re-contracting or benefits gaps, price it. A cheap vendor with painful exit terms is a lock-in disguised as a discount. For deeper cost-per-hire modelling, this guide to calculating true cost per hire is a useful companion.
How Do You Price Compliance Risk and Hidden Costs?

Estimate it, label it as an estimate, and keep it visible.
You can’t predict an audit outcome precisely. Fine. Set explicit assumptions instead: a probability of a compliance failure per country, multiplied by a plausible financial impact, then adjusted by how much control each vendor genuinely has. An owned-entity vendor with built-in legal oversight gets a lower probability than an aggregator relying on sub-contractors. Write down why, so someone can challenge it.
For impact figures, use enforcement data rather than instinct. The GDPR Enforcement Tracker records over €7.57 billion in cumulative penalties across more than 3,340 actions, and CMS Law’s analysis puts the average fine at about €2.28 million. On the US side, HHS enforcement highlights show settlements and penalties above $144 million, and HIPAA penalty tiers scale to multi-million annual caps.
Two lines deserve their own rows. First, misclassification exposure: back-taxes, penalties and, in the worst case, loss of an operating licence when contractors are really employees. Second, IP indemnification caps, because a vendor that caps liability at a month’s fees isn’t protecting your intellectual property in any meaningful way.
Permanent establishment risk is the sneaky one. The OECD Model Tax Convention updates discussed by Deloitte show how remote working can trigger corporate tax presence, and the OECD’s global mobility consultation covers the social security angle. Add security certification too: ISO 27001 costs in the UK show what a vendor’s accreditation would otherwise cost you to replicate.
How Does TCO Differ From ROI?
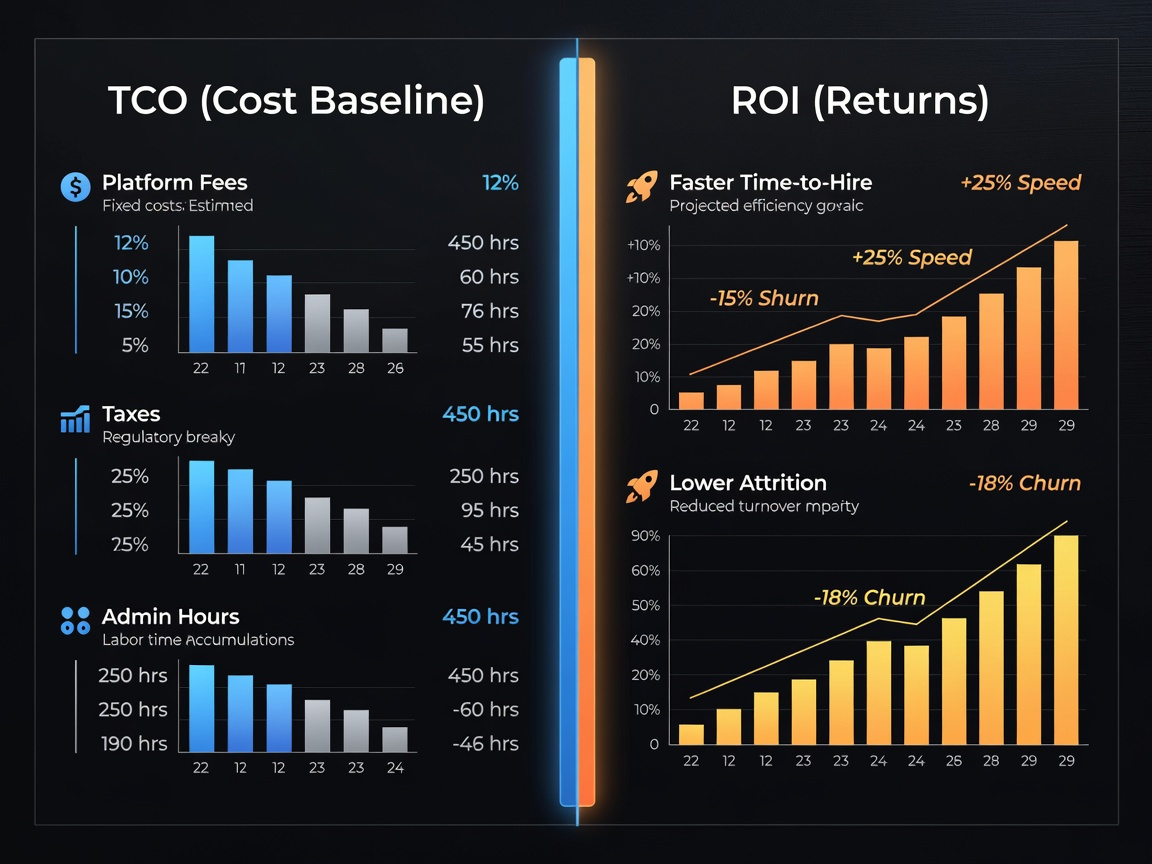
TCO asks what it costs. ROI asks what you get back. Mixing them up is how weak vendors win.
TCO is a cost-side measure, and it’s the right tool when vendors offer the same outcome (a compliant, employed remote worker in a given country). ROI needs a benefit estimate, like faster time-to-hire or lower attrition, and those benefits are far harder to prove and easy to inflate. If you start with ROI, the vendor with the best slide deck wins. Start with TCO to get a clean cost baseline, then layer ROI on top if the business case demands it. This look at the real ROI of remote hiring shows how the benefit side is usually framed.
How Should You Use Results in Procurement?

Standardise before you invite quotes. Set baseline defaults for tax percentages, admin hours and FX from third-party data, so vendors can’t tilt the assumptions. Then require the line-by-line breakdown I described earlier, with platform fees separated from employer burdens, deposits and conversion formulas.
Run three scenarios: base, high-growth and a downside where you exit at month eighteen. A vendor that wins all three is a safe pick. One that wins only the base case is a gamble.
Don’t let the lowest number decide automatically. A slightly dearer subscription is often the better financial choice if it meaningfully lowers audit or IP litigation risk. PwC’s Global Compliance Survey shows most executives see rising risk complexity, and EY’s view on third-party network exposure tells the same story for financial firms. Bring the risk-weighted figure to the table, openly.
For shortlisting frameworks, this bulk hiring comparison framework and the regulated industry platform roundup pair neatly with your spreadsheet.
Red flags worth marking in the sheet: refusal to disclose FX method, deposits without clear return terms, unclear employer-of-record entity per country, liability caps below your exposure, and quotes that exclude offboarding.
FAQ
How many years should a TCO calculator cover? Three. It captures implementation, renewals and the first real cost of switching without needing wild forecasts.
What’s the biggest hidden cost in EOR pricing? Usually FX margin and deposits. A 3% FX markup and a one-to-two-month salary deposit routinely outweigh the gap between headline fees.
Can I put a number on compliance risk? Roughly. Use probability times impact, using public enforcement data, and keep it as a separate line so assumptions stay visible.
Is the cheapest aggregator ever the right answer? Sometimes, for low-risk roles in a handful of countries with minimal oversight needs. In regulated work, rarely.
Should I include ROI in the same sheet? Keep it on a separate tab. TCO stays objective; ROI brings in benefit assumptions that can muddy the comparison.
Conclusion
Ignore the monthly fee. Build a three-year model with implementation, subscription, country burden, admin time and a risk-weighted compliance line, then make every vendor fill in the same template. The cheapest quote will often stop being cheapest once deposits, FX and your own staff hours land in the sheet.
I’d rather pay more upfront than save on a quote and leave compliance gaps hiding off-screen. Your auditors will agree.
So, which line in your current vendor quote do you trust least?